
What does “a lot of data” in a database mean?
How much data is considered “a lot”? Is it 100,000 records, 1 million, or even 100 million? Does it depend on whether it’s a gigabyte or a hundred gigabytes? When and why does the performance of a database start to “sag”? It is simply impossible to give a clear answer to these questions.
- Server Performance Bottlenecks
- Network
- CPU
- RAM + Disk
- Preventing Bottlenecks
- Mimic Production RAM
- Test with Fake Data
- Monitor Queries
- Monitor Indexes
- Troubleshooting Common Database Issues
- Is my data being displaced from memory by new queries?
- There not enough memory for the existing data.
- My query can’t be optimized
- Optimize the UI
- Sorting
- Aggregation
- Sorting by expression
- The Importance of Data Optimization
“A lot” is perhaps the vaguest definition that a developer working with a database will encounter. There are simply too many factors: server characteristics, the nature of the load, the presence of suitable indexes… the list goes on and on. Sometimes, a query might run fast, and other times the same query might run slow, even with a suitable index. In these situations, optimization is usually necessary and often requires an index suitable for the query.
Server Performance Bottlenecks
What causes bottlenecks in server performance? There are several characteristics that performance depends on:
- CPU (processor)
- RAM (random access memory)
- HDD/SDD – disk read/write speed
- Network – network data transfer speed
Any of these can be the cause of slow performance.
Network
The least likely challenge you may encounter is a fully loaded network, meaning the application is attempting to read or write too much data at once. With modern data transfer speeds, this scenario is rare; typically, any significant data volume will hit CPU, RAM, or disk bandwidth limits before overwhelming the network.
However, if you do find that the network is the bottleneck, it’s important to “reduce the appetite” for data transfers from the application side. One effective approach is to switch from client-side paging to server-side paging. Instead of sending thousands of records to the browser and managing pagination there, request data from the server one page at a time. Alternatively, you can shift data processing logic to the database server by using stored procedures, which minimizes the transfer of large data sets between the application and the database.
If your application necessitates handling and processing large volumes of data on the application server, a relational database may not be the best choice. Instead, consider implementing a MapReduce framework, such as Apache Hadoop, to efficiently manage and analyze large datasets.
CPU
The CPU rarely becomes a bottleneck for the database server, unless you abuse the triggers and stored procedures. Processing data on the database side is generally faster than on the application server, but this efficiency is contingent on moderate server loads. When the load increases to the point scaling is required, distributing the load across several application servers is recommended. Horizontal scaling is often easier than addressing the performance challenges of a database server, which typically relies on vertical scaling (i.e., upgrading to a more powerful server) or making significant changes to the application architecture.
To minimize the need for an expensive database server (such as organizing a database cluster or utilizing scalable storage like AWS Aurora) it’s more effective to implement logic within the application code rather than relying on triggers and stored procedures. This will simplify development, deployment, testing, and scaling (and therefore reduce the cost). Reserve database-side logic for situations where it mitigates the transfer of large data volumes over the network, rather than for minor performance gains, like populating default or calculated values.
RAM + Disk
These two resources are closely interconnected and are often the primary contributors to performance drops. The speed of access to RAM is approximately 3 orders of magnitude (approximately 1000 times) faster than that of HDD/SSD. When the data being searched is already in memory, access is nearly instantaneous. However, if the data must be read from disk, performance decreases significantly. To mitigate this, the database engine strives to keep as much data in RAM as possible, holding onto recently used data instead of unloading it immediately. As RAM fills up, older data is periodically displaced, which can increase IOPS (input/output operations) as the system reads from or writes to disk. Therefore, it’s essential to understand the ratio of regularly accessed data to the amount of RAM available on the server.
For instance, if your RAM is double the size of your database, you’ll likely avoid speed issues (e.g., with 1GB of server memory and a database size of 500MB), even when executing full record scans. The rationale for the double size is that when data changes, indexes must also be updated. During this process, a copy of the index is created to maintain transaction isolation, allowing one user to read the old version while another writes. While the actual mechanics are more complex, this simplification suffices for our discussion. If both the application code and the database are optimized so that all read requests utilize indexes rather than performing full table scans, this double RAM guideline holds true.
Problems arise when there isn’t enough memory to load an index, leading to cache eviction. For example, with 1GB of memory and 2GB of index data being frequently queried, the system will regularly displace data in and out of memory. In this scenario, a query that accesses data already in RAM executes quickly, while the same query that requires data from disk may run slowly or even time out if the index is large and exceeds the allotted query time. However, subsequent executions of the same query are likely to succeed as the index is then cached.
As the data volume grows, monitor:
- Indexes: Identify which ones can replace full table scans.
- Over-indexing: Too many indexes on a single table, each optimized for a specific SQL query, can prevent all of them from fitting into RAM simultaneously. Additionally, any database modification requires rebuilding multiple indexes, which can prolong write transactions due to the need for temporary copies until all affected indexes are updated.
A common challenge is that at the initial development stage there is little test data and it usually fits entirely into the RAM of the developer’s computer, without requiring special optimization. However, as the application moves to production and data volume increases, performance can sharply decline when data begins to displace from memory. Developers often struggle to replicate this issue on their machines, which operate in single-user mode and do not experience the same displacement effects as the server. When they try to diagnose slow SQL queries, those queries may execute quickly on subsequent attempts because the data has been cached. This makes it challenging to reproduce the problem, especially if another user has recently run a similar query.
Preventing Bottlenecks
To solve problems proactively, take action during development and not when the problems arise in production. Follow a few simple rules
Mimic Production RAM
Often, the memory on the developer’s machine exceeds the memory on the production server. For example, the developer’s computer may have 16 or 32 GB of RAM, while the cloud server has only 2 or 4 GB. In this scenario, the developer will not encounter problems, but production might. To manage memory consumption on the database server, you can adjust the settings within the database itself (such as PostgreSQL) or run the database within a Docker container with specified RAM limits.
Overall, deploying the entire project in Docker with these predefined settings is an excellent way to replicate the production environment.
Test with Fake Data
To test how efficiently your solution works, it’s crucial to operate under conditions that closely resemble production. This can be achieved by either using a dump from the production server that reflects real data volumes or generating a sufficient amount of synthetic data for performance testing. Data should be diverse and vary in type. Many popular frameworks, such as Laravel, include built-in capabilities for generating fake data (e.g., Factories). Alternatively, you can leverage libraries like Faker, which have ports for different programming languages. Instead of manually inputting a dozen or so records, aim to generate several thousand (or even tens of thousands) records for the key entities in your project. The most serious performance problems should appear obvious.
Monitor Queries
Lots of developer tools, including various “spy gadgets”, provide deep insights into your application’s behavior. Tools like Laravel Telescope, Symfony Profiler, and similar options for other platforms enable you to monitor executed SQL queries within your application. This functionality allows you to identify N+1 issues, pinpoint the slowest SQL queries that may require optimization, and reveal the actual SQL statements generated and executed by your ORM. Often, you may discover that a different query is being executed behind the scenes than what you initially anticipated.
Monitor Indexes
Indexes can dramatically accelerate query performance, often increasing speed by an order of magnitude or more. You can monitor executed queries, run them manually, and analyze their execution plans. Alternatively, you can leverage PostgreSQL’s usage statistics to help you monitor:
- What exactly is used in your database and how
- What exactly is NOT used.
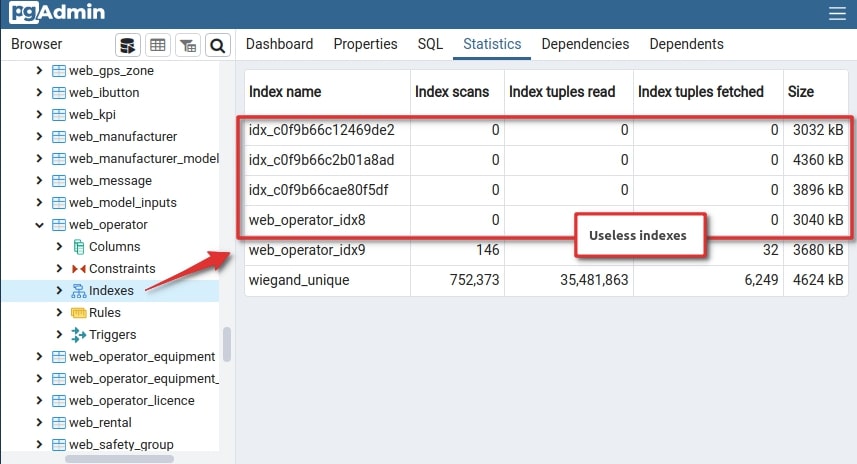
Image 1 – Unused indexes
If your database has indexes that are never used, it is better to delete them to avoid wasting resources on them. When adding new records, the index needs to be updated, and this may require reading a rarely used index from disk to memory, which will significantly slow down write operations. Removing unused garbage is an important part of optimization.
Troubleshooting Common Database Issues
Is my data being displaced from memory by new queries?
There is no tool that will give a direct answer to this question. You will have to independently investigate the following points:
- Identify Queries Causing Full Table Scans: Pay attention to queries that lead to full table scans, particularly on tables with a large and growing number of records. For example, in pgAdmin:
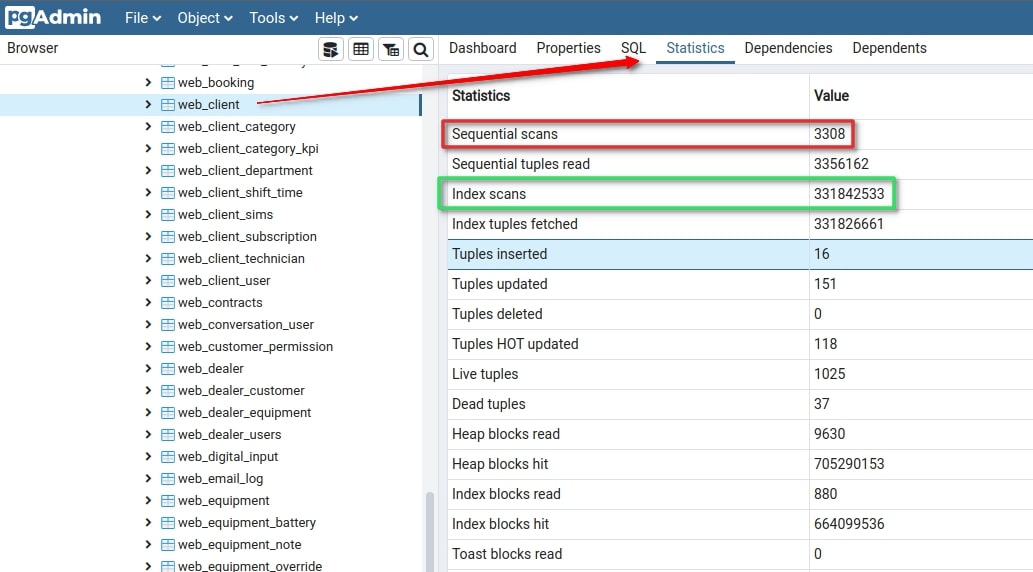
Image 2 – Example of a table with many scanning queries
Monitor these over time by resetting statistics and analyzing table accesses after using the application for a while. Remember that with a small number of records (up to several hundred), the query planner might opt for a full scan even when an index is available. For tables expected to grow, like those for recurring billing or client invoicing, generate fake data before production. You can generally ignore full scans for directories with only a few dozen records that won’t expand.
- Evaluate Total Index Volume: Check if the total volume of indexes exceeds half of the server’s RAM. If it does, you may face cache eviction, where some data is periodically displaced from the cache by new entries.
- Monitor Query Performance Variability: Are there queries that occasionally run slowly (possibly timing out) but then execute quickly on subsequent attempts? Such performance fluctuations typically indicate that previous data has been evicted from memory, causing delays for subsequent queries.
- Watch for Slowing Queries: If some queries that previously executed quickly are now slow or timing out—despite low CPU usage—check if IOPS consumption, especially for reads, has significantly increased.
There not enough memory for the existing data.
If you have already encountered symptoms of Cache Eviction, then first of all you need to take measures to reduce the RAM consumption of the DB server.
- Check if some tables are being scanned, especially the large ones, without using indexes. This operation itself leads to increased IOPS consumption, and also pushes indexes out of memory, which also have to be re-read from the disk – an additional waste of IOPS. If you are using inexpensive shared hosting or VPS (from AWS or similar services), then the IOPS limitation can become a problem very quickly.
- Reduce the overall size of the indexes themselves:
- Delete the unused indexes
- Stop using Covering Indexes. Under normal conditions, they increase performance by reducing the number of read operations. But under conditions of insufficient RAM, it’s the opposite.
- Use Partial Indexes. If the same condition is added to all queries (for example, soft delete – you have a deleted_at column and you almost always select only users who have not yet deleted their account), then instead of creating an index on the deleted_at column, you can add the
WHERE deleted_at IS NULLcondition to other indexes (for example, for searching by first and last name), and the index will be smaller by the number of deleted accounts, and search operations will be faster. The query execution plan will be simpler, because after searching for a filter by first/last name, there is no longer a need to filter the found records bydeleted_at IS NULL– they are simply not in the index, and the query planner knows about it.
- Reduce the amount of data loaded into memory at the same time:
- Use Partial Indexes for multi-tenant applications – when you have multiple clients, and each client needs to work only with their own data. Let’s say you have a table with hundreds of millions of records, and there are several indexes on it – each will be several gigabytes in size (let’s say 5Gb). For some reason, this index was evicted from memory. No matter which client initiates the SQL query that requires this index, 5Gb must be read from disk into memory – this may take longer than the query timeout, and the size of the occupied memory will increase by 5Gb. Let’s say we have a thousand clients. If instead of one index for the entire table we create 1000 partial indexes – one per client, each with the condition
WHERE client_id=<clientID>, then on average the size of a partial index will be 50 MB (for some it is a little more, for others a little less). Now, when a SQL query is initiated by a client whose index is not loaded into memory, the server needs to read an index of 10-100 MB, and this requires less time and memory. Moreover, not all clients may be active at the same time – for example, if they are in different time zones, and their working day begins and ends with a shift – in practice, this leads to less “slowdowns” for clients. - Use Table Partitioning for multi tenant applications or time-series data. The idea is the same as with index partitioning, but the level of isolation between data is higher. It works especially well when there is a lot of new data coming in, but not all the data is in demand. For example, most queries would involve recent periods (current month, current year), and all older data exists in an archive. Often in such cases, programmers manually move records from one table to another in order to reduce the amount of operational data in the “main” table. In this case, the “archived” data is more difficult to access, and the transfer itself is a rather expensive operation, often ending in a timeout or provoking timeouts of other requests (especially for writing). Partitioning solves this problem much more elegantly – obsolete data is available on par with recent data, but if there are no requests to it, it simply “takes up disk space” and does not require valuable resources from the server – RAM and CPU. The archiving process is not required.
- Use Partial Indexes for multi-tenant applications – when you have multiple clients, and each client needs to work only with their own data. Let’s say you have a table with hundreds of millions of records, and there are several indexes on it – each will be several gigabytes in size (let’s say 5Gb). For some reason, this index was evicted from memory. No matter which client initiates the SQL query that requires this index, 5Gb must be read from disk into memory – this may take longer than the query timeout, and the size of the occupied memory will increase by 5Gb. Let’s say we have a thousand clients. If instead of one index for the entire table we create 1000 partial indexes – one per client, each with the condition
My query can’t be optimized
Occasionally a query can’t be optimized with indexes, even when the server has enough resources (CPU, RAM, disk I/O). This often happens when the UI is designed without taking into account how the database works.
For example, atypical UI:
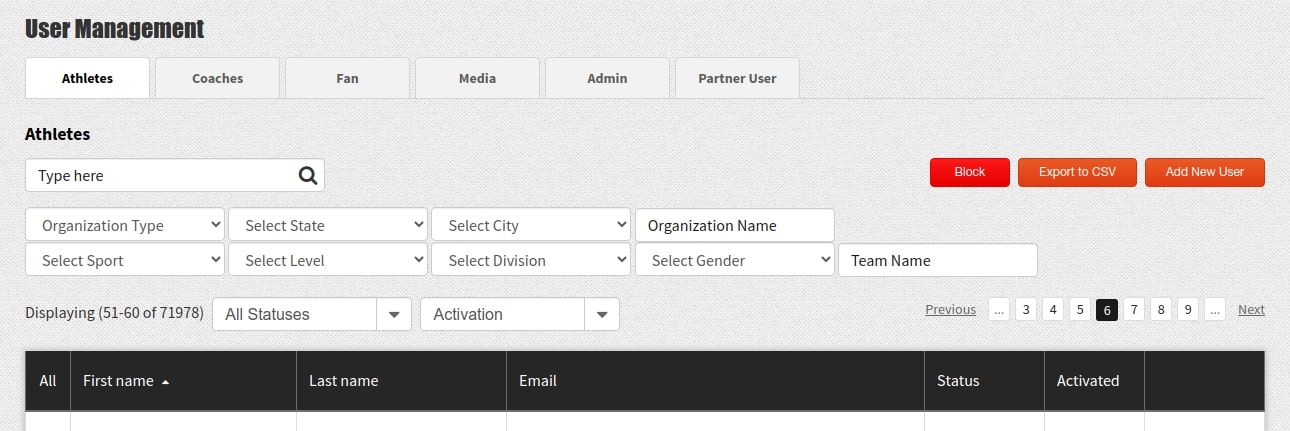
Image 3 – Standard example of a search form
You have a list of users filtered by user-defined criteria, sorted by a selected column, and employing server-side pagination. The bottleneck on this page is likely to be the counting of records that match the selection criteria. Creating indexes for every possible combination of filters can be prohibitively expensive. As a result, certain filter combinations (if not all) will likely result in a full table scan. While retrieving the first page of results may be relatively quick, counting the total number of matching records can be time-consuming.
Optimize the UI
If optimizing the SQL query isn’t feasible, focus on enhancing the UI to generate queries that can be optimized. The primary performance bottleneck is not the volume of source data but rather the number of records that must be iterated to achieve the desired outcome. In addition to filtering—effectively optimized with indexes—three factors contribute to iterating over a large set of records:
- Sorting by a criterion that does not align with the index used for filtering.
- Counting the records that meet the search criteria (or any form of aggregation).
- Sorting based on an expression that can’t be indexed, such as a subquery or calculations like distance from the user’s location.
These are the things that should be avoided if possible.
Sorting
Let’s break down the problem of query performance using an analogy. Imagine a corridor lined with stickers labeled with numbers. You have specific tasks:
- Retrieve 10 stickers.
- Count the total number of stickers.
- Retrieve the 10 stickers with the largest numbers.
The first task is straightforward—you can quickly grab the first 10 stickers. The second task requires you to traverse the entire corridor to count all the stickers. The third task involves checking the entire corridor to find the largest numbers, making it a more time-consuming endeavor. These tasks exemplify non-indexed queries.
Now, if the stickers are arranged in descending order, the third task becomes significantly easier, as you can simply take the last 10 stickers without additional searching. This illustrates the importance of having your index order match the required sorting order for optimized performance.
Consider another scenario with coins sorted into piles by denomination. If tasked with retrieving coins greater than 2 rubles and finding the oldest among them, you can quickly identify the relevant piles, but you’ll still need to sift through all the coins to determine their ages. This situation arises when the sorting criterion for the result doesn’t align with the sorting order of the index. If, however, the coins were pre-sorted by the year of issue, retrieval would be much simpler.
You can apply this concept to your UI design. If the “natural” sorting order of the records is known, you can incorporate that order into your indexes, especially for foreign keys. For instance, consider a competition with participants ranked by their results. If you create an index sorted by event ID first and then by place, the ORM will automatically load participants in ascending order of their ranks, unless specified otherwise. This indexing strategy helps avoid unnecessary sorting in the query execution plan, ensuring efficient performance even with many participants.

And only then create a foreign key constraint by event_id, then this index will be used by CONSTRAINT and when loading participants using ORM, they will be sorted in ascending order of occupied places, unless otherwise specified explicitly, and also the presence of a sorting order in the index will lead to the query planner not adding sorting to the query execution plan when ORDER BY event_competitors.place is explicitly specified in the query – even if there were many participants, the query will be executed quickly. To maintain this optimization, avoid allowing users to change the default sorting order in the UI. If users can only see results in the optimized order, they will benefit from faster performance.
Leveraging clustered indexes can also enhance performance. For a user list, consider creating a clustered index based on first and last names rather than the ID. This adjustment changes the physical order of record storage on disk, allowing queries to return results in alphabetical order without needing an explicit sort. Therefore, ensure that the default sorting order in your UI matches the database’s optimized structure to maximize performance across most user scenarios.
Aggregation
Calculating totals, averages, and other metrics necessitates iterating through all records that match specific search criteria. Therefore, it’s crucial to narrow the search parameters to minimize the result set.
Consider a real estate platform with a database of one million listings across 100 cities. When displaying listings sorted by distance from a user’s location, instead of querying all listings and then sorting them, it’s more efficient to first determine the user’s city based on their location. This approach significantly reduces the number of records that need distance calculations—potentially by two orders of magnitude—while ensuring the first page of results remains relevant, as the closest listings will typically be within the user’s city.
- What if the city or other filtering criteria are unknown? You can redesign the user interface to prompt the user for this information upfront. Alternatively, employ an intelligent guess that asks for confirmation from the user. Even if the guess is incorrect and the user inputs their location manually, the overhead of two lightweight requests is preferable to executing a heavy query for every user.
- If your technical specifications indicate that initial search criteria may be absent, consider displaying a map showing the number of listings in each city alongside the initial results. Caching or denormalization can help here. Since listing data does not change instantaneously, you can cache these results for efficiency or maintain aggregated counts (e.g., listings by city) that update asynchronously when changes occur. This reduces the load on your database by only recalculating totals when necessary. Similarly, caching results for common filters—like “only apartments” or “only houses”—can enhance performance, but caching every possible combination of filters may lead to resource waste due to low cache hit rates.
Regarding record counts, you don’t always need to display this figure immediately. Instead, return page content and record counts asynchronously. For instance, if retrieving page content takes 200 milliseconds but counting records takes 3 seconds, you can make two separate HTTP requests from the UI: one for the records and another for the count. This way, users will see the list of elements in a timely manner while the count is calculated in the background. During pagination, the total number of records is unlikely to change, allowing you to either avoid updating this count entirely or perform a separate request for it. For users, a few seconds’ delay in the record count becomes imperceptible when the list loads quickly.
Sorting by expression
One of the things that really hurts performance is subqueries and expressions. In fact, this is the N+1 problem that has “moved” to the database server side. For example, calculating the number of orders that users have made:

When querying the database for a single page of results, it must first count the number of orders for each user. If you then ask it to sort users based on this count, the database has to compute the order counts for all users, sort them accordingly, and return just the first page of results:

This issue also arises with expressions that lack indexing capabilities (such as searching for a substring within concatenated first and last names) or those that cannot be indexed at all, like using non-immutable functions (e.g., calculating the difference between a timestamp field and the current time). In these scenarios, performance can degrade rapidly with large datasets.
If you can design the UI to avoid sorting by calculated columns, you can maintain performance even as the data volume grows. For instance, calculating the “number of user orders” for a single page will require similar resources whether you have 1,000 users or 1,000,000. However, if sorting by such a column is necessary and your data volume is expected to increase indefinitely, it’s essential to convert that expression into a stored, preferably indexed value.
One effective approach is to store the order count in a separate, indexed column that can be updated via a trigger or application code—this is a form of database denormalization.
While COUNT() serves as a straightforward example, denormalized data can take many forms. For instance, using Laravel Scout with PostgreSQL can facilitate storing various text values in a full-text search field, including data from child records, to optimize user text queries. If your entities include “advertisement for sale,” “property type,” and “state,” where the ads only reference foreign keys for “property type” and “state,” you can index searchable text values from these directories in a dedicated field. This allows a user query like “I want a house in California” to quickly find relevant listings based on a single indexed field instead of executing a complex query involving multiple joins and conditions.
What about expressions that can’t be indexed or denormalized, such as calculating the distance from a user’s location? In such cases, consider the following strategies:
- Filter Records by Derived Criteria: Use other parameters to narrow down the results. For instance, determine the user’s city from their location, filter by city, and sort ads exclusively from that area.
- Decompose the Expression: Break down the expression into a deterministic part that can be indexed (such as a calculated column), an argument that can be passed as a parameter, and an operator that utilizes the index. This approach can help optimize performance even for complex queries.
The Importance of Data Optimization
Congratulations – you now have a foundational understanding of how optimizing data can significantly enhance database performance and minimize load times! We’ve explored the challenges that large datasets can pose if not properly managed during development. By effectively optimizing data handling and utilizing indexing strategically, you can ensure your system operates smoothly, even when managing substantial volumes of information. Embracing these practices not only improves efficiency but also enriches the user experience, unlocking the full potential of your data-driven applications.